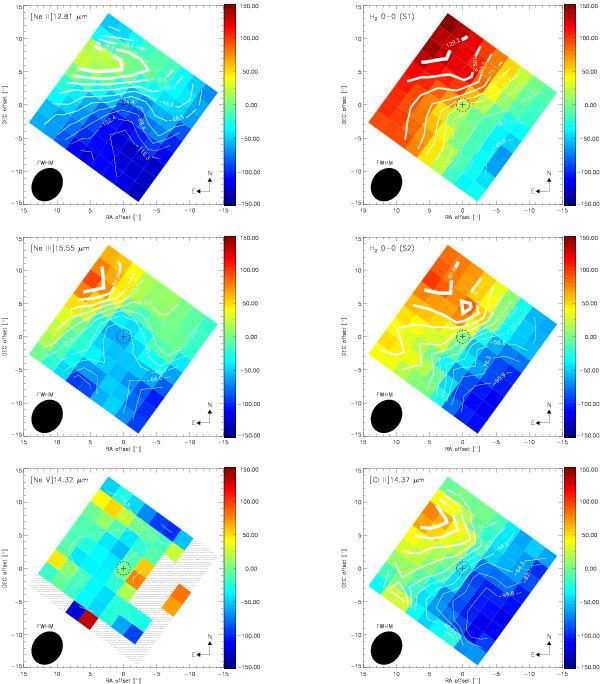
Fig. 12

The left panel shows (from top to bottom) the velocity fields of the fine-structure lines [Ne II] 12.81 μm, [Ne III] 15.56 μm, and [Ne V] 14.32 μm. The right panel shows (from top to bottom) the molecular hydrogen lines H2 0−0 S(1) 17.0 μm, along with S(2) 12.3 μm, and the [Cl II] 14.37 μm. The maps, covering a region of ~23′′ × 23′′ (~426 × 426 pc2), are consistent with a rotating disk, with the exception of the [Ne V] line, which presents a relatively uniform (most likely not spectrally resolved) velocity field.
Current usage metrics show cumulative count of Article Views (full-text article views including HTML views, PDF and ePub downloads, according to the available data) and Abstracts Views on Vision4Press platform.
Data correspond to usage on the plateform after 2015. The current usage metrics is available 48-96 hours after online publication and is updated daily on week days.
Initial download of the metrics may take a while.


