Fig. 22
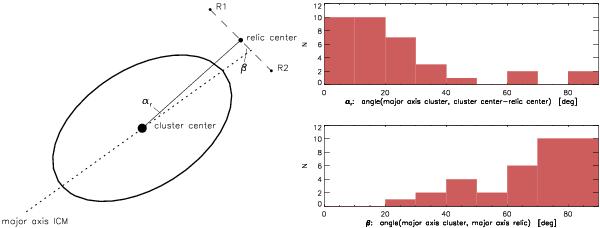
Left: schematic illustration of the angle between the major axis of the ICM and the line relic center-cluster center (αr), and the angle between the relic orientation and major axis of the ICM (β), see Table 4. Top right: histogram of angles between the major axis of the X-ray emission and the line connecting the cluster center with the center of the relic. Bottom right: histogram of angles between the major axis of the X-ray emission and the relic’s major axis.
Current usage metrics show cumulative count of Article Views (full-text article views including HTML views, PDF and ePub downloads, according to the available data) and Abstracts Views on Vision4Press platform.
Data correspond to usage on the plateform after 2015. The current usage metrics is available 48-96 hours after online publication and is updated daily on week days.
Initial download of the metrics may take a while.