Fig. 18
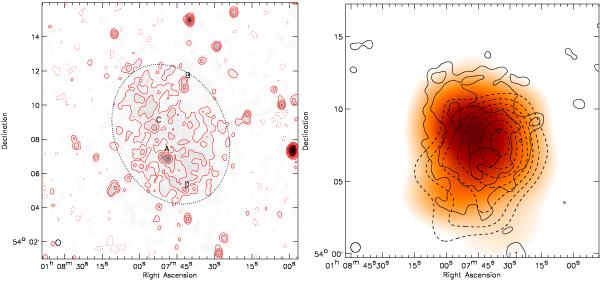
Left: CIZA J0107.7+5408 WSRT 1382 MHz image. Contour levels are drawn as in Fig. 1. Black dotted lines indicate the integration area for the flux measurement. Discrete sources embedded in the diffuse emission are alphabetically labeled, see Table 3. Right: CIZA J0107.7+5408 X-ray emission from ROSAT in orange. The original image from the ROSAT All Sky Survey was convolved with a 225″ FWHM Gaussian. Solid contours are from the WSRT 1382 MHz image convolved to a resolution of 40″. Compact sources were subtracted and contours are drawn at levels of [1,2,4,8,...] × 0.3 mJy beam-1. Dashed contours show the galaxy iso-density distribution derived from INT images. Contours are drawn at [1.0,1.2,1.4,...] × 0.3 galaxies arcmin-2 selecting only galaxies with colors 0.85 < V − R < 1.15, 0.6 < R − I < 0.9, i.e., within 0.15 mag the V − R and R − I color of the central cD galaxy.
Current usage metrics show cumulative count of Article Views (full-text article views including HTML views, PDF and ePub downloads, according to the available data) and Abstracts Views on Vision4Press platform.
Data correspond to usage on the plateform after 2015. The current usage metrics is available 48-96 hours after online publication and is updated daily on week days.
Initial download of the metrics may take a while.