Fig. 17
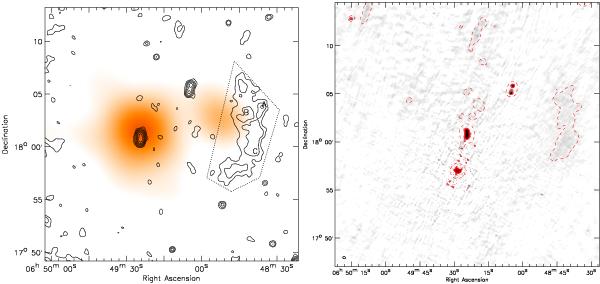
Left: CIZA J0649.3+1801 X-ray emission from ROSAT in orange. The original image from the ROSAT All Sky Survey was convolved with a 225″ FWHM Gaussian. Solid contours are from the GMRT 610 MHz image convolved to a resolution of 25″ and drawn at levels of [1,2,4,8,...] × 4σrms. The source NVSS J064928+175700 was removed using the “peeling”-method (e.g., Noordam 2004). Black dotted lines indicate the integration area for the flux measurement. Discrete sources embedded in the diffuse emission are alphabetically labeled, see Table 3. Right: CIZA J0649.3+1801 GMRT 241 MHz image. Contour levels are drawn as in Fig. 1. The dashed line is the 15 mJy beam-1contour of the 241 MHz images convolved to a circular beam of 45″.
Current usage metrics show cumulative count of Article Views (full-text article views including HTML views, PDF and ePub downloads, according to the available data) and Abstracts Views on Vision4Press platform.
Data correspond to usage on the plateform after 2015. The current usage metrics is available 48-96 hours after online publication and is updated daily on week days.
Initial download of the metrics may take a while.