Free Access
Fig. 1
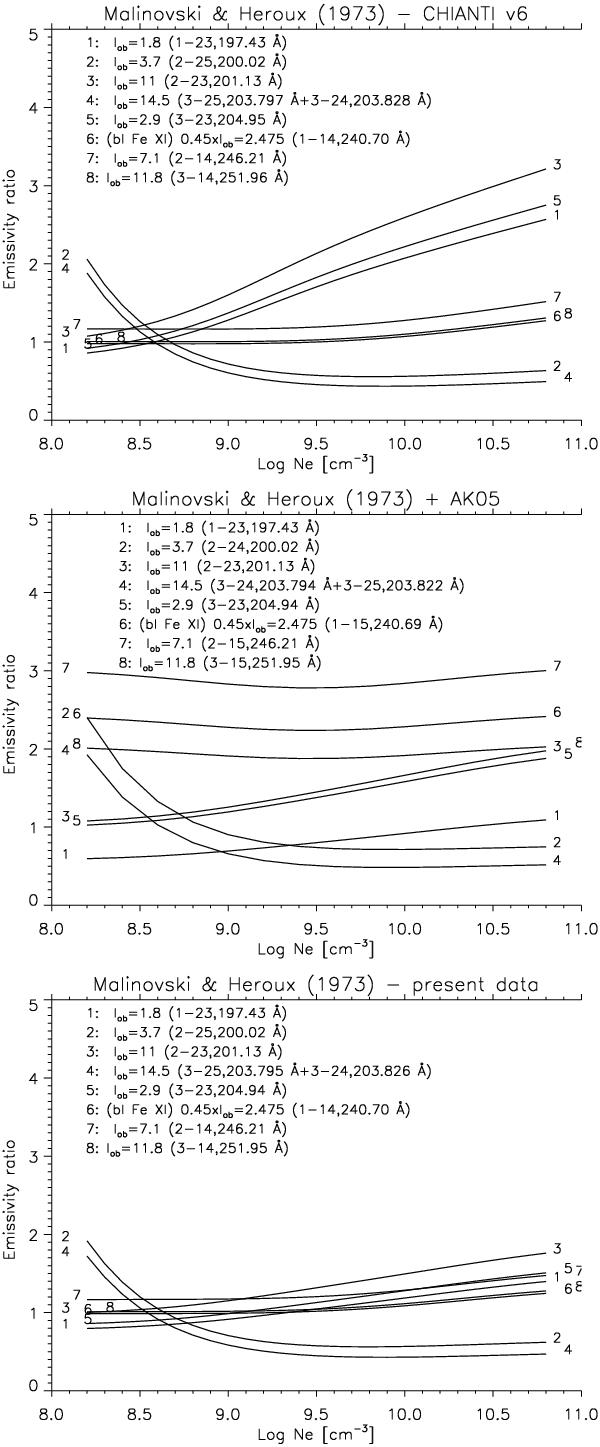
Emissivity ratio curves relative to the full-Sun spectrum of Malinovsky & Heroux (1973), and the atomic data from GT98, AK05 and SZ10. Iob indicates the observed irradiances (10-3 erg cm-2 s-1). The indices of the lower and upper levels as in Table 1 and the present experimental wavelengths (Table 2) are also shown.
Current usage metrics show cumulative count of Article Views (full-text article views including HTML views, PDF and ePub downloads, according to the available data) and Abstracts Views on Vision4Press platform.
Data correspond to usage on the plateform after 2015. The current usage metrics is available 48-96 hours after online publication and is updated daily on week days.
Initial download of the metrics may take a while.