Fig. 8
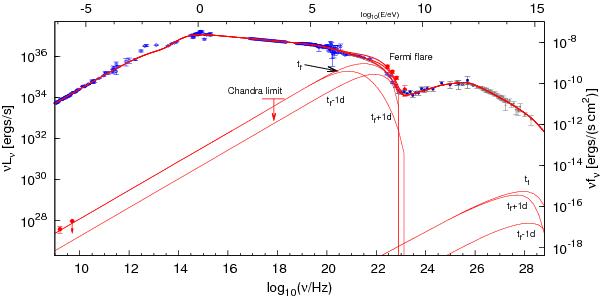
The spectral energy distribution of the nebula and the flaring component C1. The data on the nebula have been compiled in Meyer et al. (2010). Details on the modelling of the synchrotron nebula are provided in that reference as well. In addition to the nebula, the SED of the feature C1 is shown together with a time-dependent model of the flare (solid red line), with spectra calculated at the epoch of the flare maximum (tf) and one day before (tf − 1d) and after (tf + 1d) the maximum.
Current usage metrics show cumulative count of Article Views (full-text article views including HTML views, PDF and ePub downloads, according to the available data) and Abstracts Views on Vision4Press platform.
Data correspond to usage on the plateform after 2015. The current usage metrics is available 48-96 hours after online publication and is updated daily on week days.
Initial download of the metrics may take a while.