Fig. 7
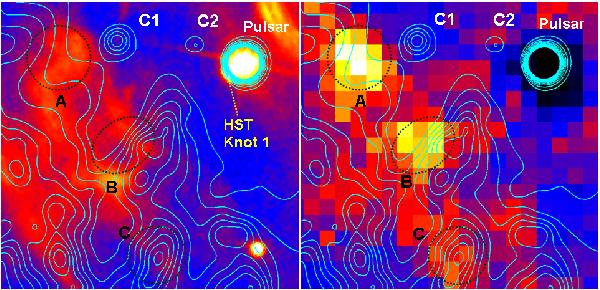
Image of the radio emission (green contours; multi-scale CLEAN image, convolved with a 0 7 beam; contours start at SNR = 2 and increase with an interval of 0.5) overlaid with images of the optical (left panel, 02 October 2010; Caraveo et al.2010) and X-ray (right panel, 28 October 2010; Ferrigno et al.2010a) emission in the flaring region. The radio emission from the flaring region C1 is offset from the knot A (Tavani et al. 2011) identified in the optical and X-ray emission. The overall appearance of the optical and radio emission is similar in the flaring, with a clear “knee-like” structure seen in the optical and trailed by a similar structure in the radio. It should also be noted that the apparent discrepancy in appearance of C1 and C2 in this figure and in the image in Fig. 3 (convolved with a
  beam) results from the fact that the component C2 is compact (
 in size) while the size of C1 can be as large as
  (see discussion in Sect. 3.2).
Current usage metrics show cumulative count of Article Views (full-text article views including HTML views, PDF and ePub downloads, according to the available data) and Abstracts Views on Vision4Press platform.
Data correspond to usage on the plateform after 2015. The current usage metrics is available 48-96 hours after online publication and is updated daily on week days.
Initial download of the metrics may take a while.