Fig. 4
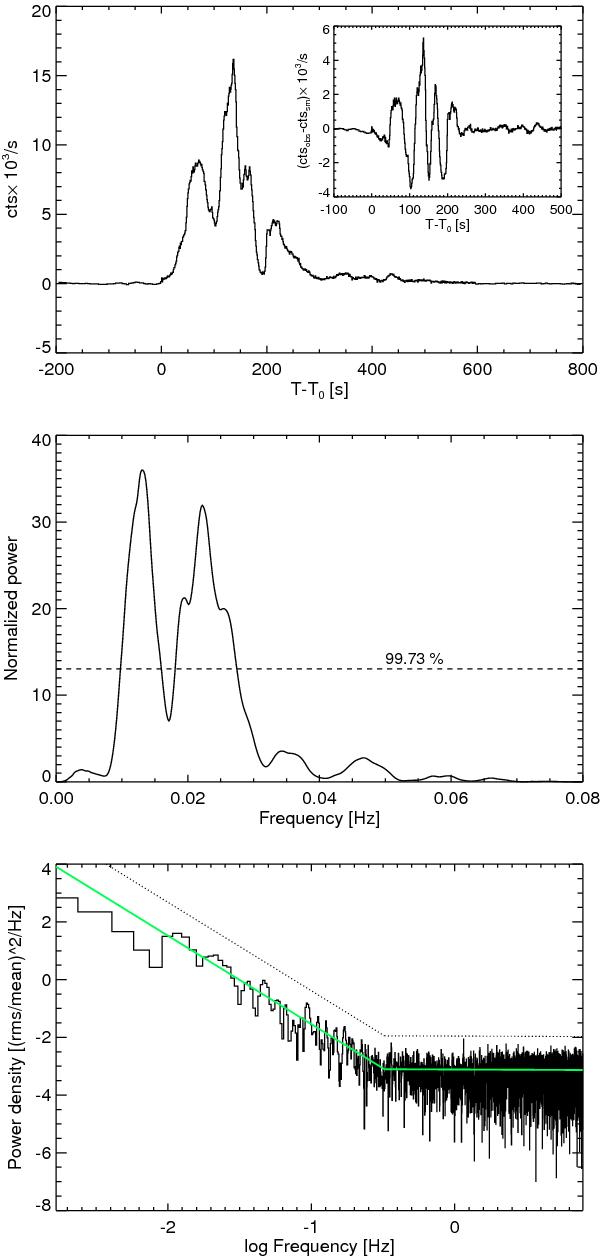
Upper panel: summed and background subtracted light curve of the solar flare observed by GBM on 2011 February 24. The inset shows the residual emission after subtracting a simple (boxcar) moving average. Middle panel: periodogram analysis performed on the residual emission. Two peaks are above the 3σ confidence limit (dashed line). Lower panel: PSD of the same solar flare. Best fit broken power-law to the PSD continuum (solid green line) and the 3σ significance level (dotted line) are indicated.
Current usage metrics show cumulative count of Article Views (full-text article views including HTML views, PDF and ePub downloads, according to the available data) and Abstracts Views on Vision4Press platform.
Data correspond to usage on the plateform after 2015. The current usage metrics is available 48-96 hours after online publication and is updated daily on week days.
Initial download of the metrics may take a while.