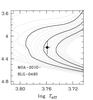
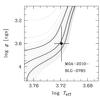
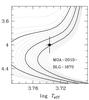
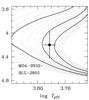
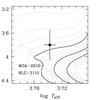
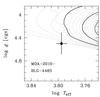
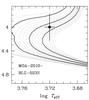
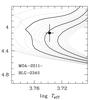
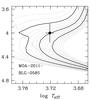
Fig. 2
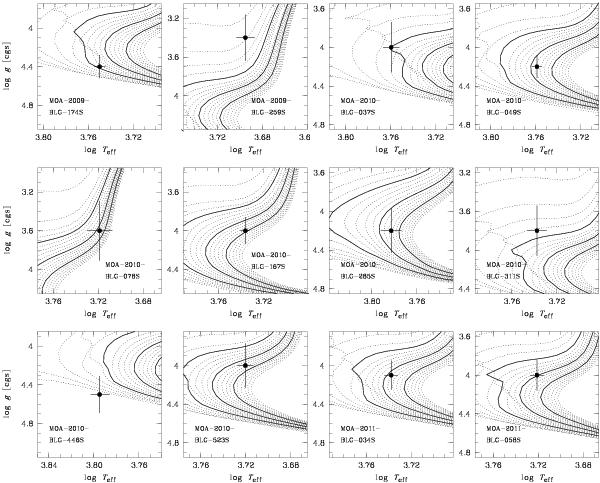
The 12 new microlensed stars plotted on the α-enhanced isochrones from Demarque et al. (2004). Each set of isochrones have been calculated with the same metallicity and α-enhancement as derived for the stars. In each plot the solid lines represent isochrones with ages of 5, 10, and 15 Gyr (from left to right). Dotted lines are isochrones in steps of 1 Gyr, ranging from 0.1 Gyr to 20 Gyr. Error bars represent the uncertainties in and log g as given in Table 2. Note that ages reported in Table 3 need not coincide exactly with the ages that may be read off directly from the figures. The age determinations are based on probability distribution functions and is described in Sect. 3.
Current usage metrics show cumulative count of Article Views (full-text article views including HTML views, PDF and ePub downloads, according to the available data) and Abstracts Views on Vision4Press platform.
Data correspond to usage on the plateform after 2015. The current usage metrics is available 48-96 hours after online publication and is updated daily on week days.
Initial download of the metrics may take a while.