Fig. 9
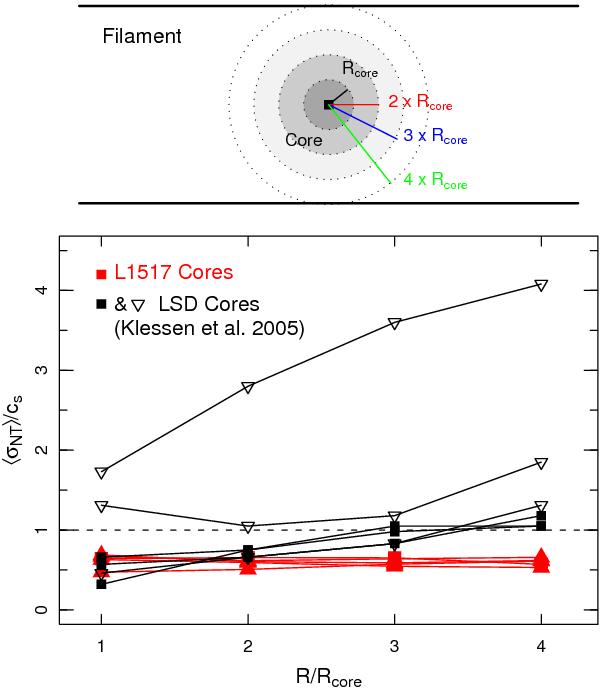
Comparison between the C18O nonthermal velocity dispersion around each L1517 core and the predictions from a model of turbulent core formation. Top: schematic view illustrating how the velocity dispersion has been averaged inside four concentric shells around each core. Bottom: comparison between the observed C18O data (red solid triangles) and the predictions from the LSD model by Klessen et al. (2005). The black solid squares represent the three different projections of a fully subsonic core, while the open inverted triangles represent the three projections of a core that has transonic motions in one of them.
Current usage metrics show cumulative count of Article Views (full-text article views including HTML views, PDF and ePub downloads, according to the available data) and Abstracts Views on Vision4Press platform.
Data correspond to usage on the plateform after 2015. The current usage metrics is available 48-96 hours after online publication and is updated daily on week days.
Initial download of the metrics may take a while.