Fig. 8
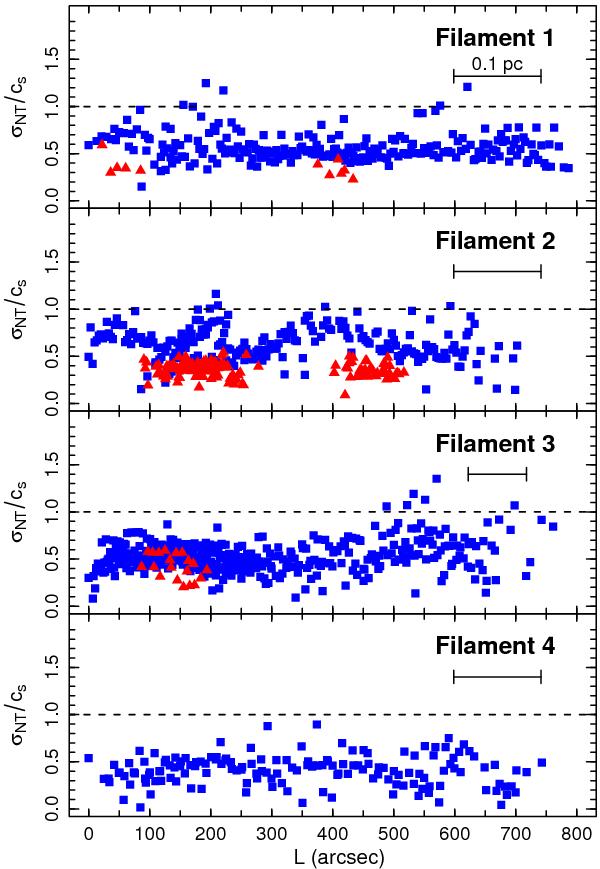
Distribution of nonthermal velocity dispersion as a function of position along each of the L1517 filaments. Blue squares represent C18O(1–0) and red triangles and N2H+(1–0) values. The spatial scale for filament 3 has been shrunk by a factor of 1.5 in order to fit it into the reduced box size used for the other filaments. The mean formal error in the σNT/cs determination is 0.1 for both N2H+ and C18O, which is approximately the marker size.
Current usage metrics show cumulative count of Article Views (full-text article views including HTML views, PDF and ePub downloads, according to the available data) and Abstracts Views on Vision4Press platform.
Data correspond to usage on the plateform after 2015. The current usage metrics is available 48-96 hours after online publication and is updated daily on week days.
Initial download of the metrics may take a while.