Fig. 6
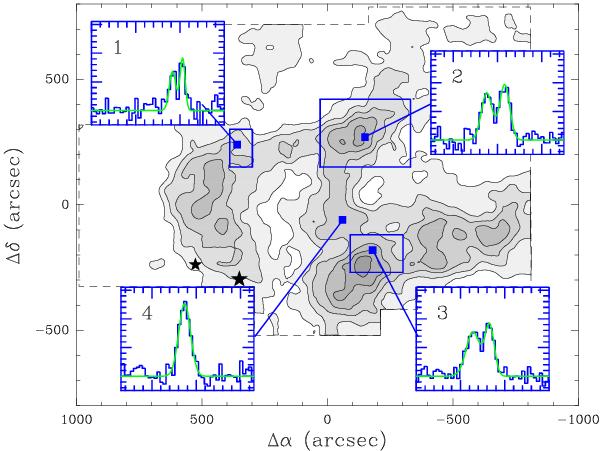
Graphical summary of the Gaussian fits to the C18O(1–0) emission in L1517. The gray scale shows the C18O(1–0) integrated intensity map of Fig. 1, and the superposed blue boxes enclose the regions where two Gaussians were fitted to the spectra. Insets with numbers 1, 2, and 3 illustrate double-Gaussian fits, while inset number 4 shows an example of the dominant single Gaussian fitted to most of the cloud spectra.
Current usage metrics show cumulative count of Article Views (full-text article views including HTML views, PDF and ePub downloads, according to the available data) and Abstracts Views on Vision4Press platform.
Data correspond to usage on the plateform after 2015. The current usage metrics is available 48-96 hours after online publication and is updated daily on week days.
Initial download of the metrics may take a while.