Fig. 5
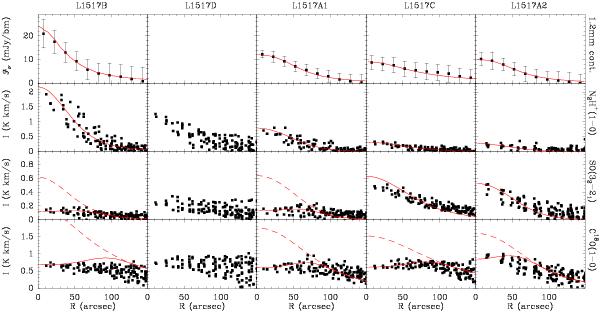
Radial profiles of 1.2 mm continuum, N2H+(1–0), SO(32–21), and C18O(1–0) emission towards the dense cores in L1517. The cores were ordered by decreasing central emission of N2H+(1–0) to illustrate a possible evolutionary sequence (see text). The 1.2 mm data were averaged over 15′′-wide intervals to increase legibility. In each panel, the solid red line represents the best fit-model, and when an additional dashed line is presented, the best fit required a central abundance hole and the dashed line represents the constant abundance model for comparison. No modeling of core D was attempted for lack of mm-continuum data.
Current usage metrics show cumulative count of Article Views (full-text article views including HTML views, PDF and ePub downloads, according to the available data) and Abstracts Views on Vision4Press platform.
Data correspond to usage on the plateform after 2015. The current usage metrics is available 48-96 hours after online publication and is updated daily on week days.
Initial download of the metrics may take a while.