Fig. 4
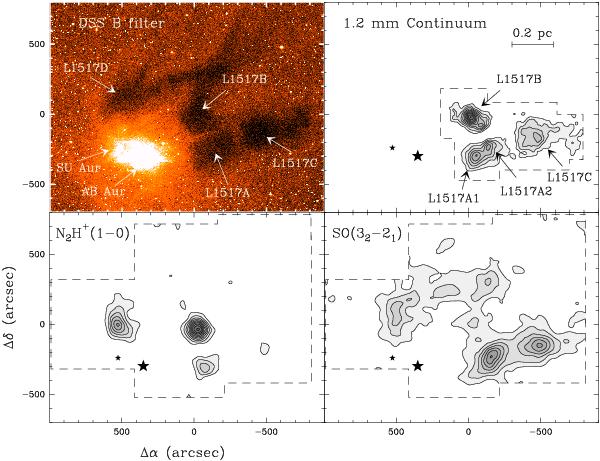
Core population of L1517. From left to right and from top to bottom: contrast-enhanced DSS blue image identifying the core positions, 1.2 mm dust continuum emission, N2H+(1–0) integrated intensity, and SO(32–21) integrated intensity. Offsets and star symbols are as in Fig. 2. First contour and spacing are 2 mJy/11′′-beam for 1.2 mm continuum, 0.16 K km s-1 for N2H+(1–0), and 0.08 K km s-1 for SO(32–21). To enhance the sensitivity to extended emission, the 1.2 mm continuum map has been convolved to an equivalent resolution of 30′′, and the N2H+ and SO maps to a resolution of 75′′.
Current usage metrics show cumulative count of Article Views (full-text article views including HTML views, PDF and ePub downloads, according to the available data) and Abstracts Views on Vision4Press platform.
Data correspond to usage on the plateform after 2015. The current usage metrics is available 48-96 hours after online publication and is updated daily on week days.
Initial download of the metrics may take a while.