Fig. 2
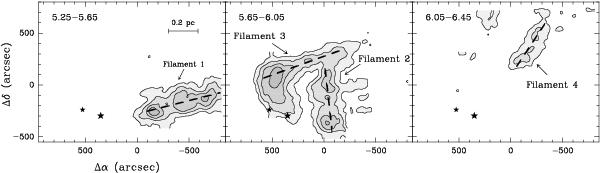
Maps of C18O(1–0) intensity integrated every 0.4 km s-1 to illustrate the separation of the gas into filaments. The dashed lines indicate our best guess of each filament axis, and the star symbols mark the positions of AB Aur (larger) and SU Aur (smaller). First contour and interval are 0.2 K km s-1. Offsets are referred to  , δ(J2000) = + 30°38′04′′. The LSR velocity range of integration is indicated in the upper left corner of each panel.
Current usage metrics show cumulative count of Article Views (full-text article views including HTML views, PDF and ePub downloads, according to the available data) and Abstracts Views on Vision4Press platform.
Data correspond to usage on the plateform after 2015. The current usage metrics is available 48-96 hours after online publication and is updated daily on week days.
Initial download of the metrics may take a while.