Fig. 12
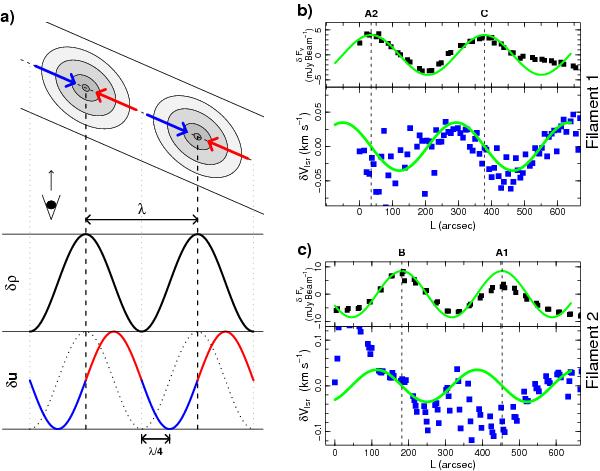
Kinematic modeling of the velocity oscillations in filaments 1 and 2. a) Schematic view showing how a core-forming velocity field along the filament axis causes a λ/4 shift between the sinusoidal perturbations of density and velocity. b), c) Comparison of the density and velocity perturbations in filaments 1 and 2 with the expectation from the simple kinematic model. For each filament, the upper panel (black squares) shows the increment of mm continuum flux over the mean (a proxy for the density perturbation), and the lower panel (blue squares) shows the variation in the C18O centroid velocity over the filament mean (after subtraction of a linear gradient). The green solid line in each upper panel is a sinusoidal fit to the density perturbation, from which a wavelength and phase are determined. The green solid line in each bottom panel is the result of shifting the density sinusoid by λ/4 (plus scaling it arbitrarily), and represents the expected pattern for a core-forming velocity field. The mean formal error in the δVLSR determination is 0.01 km s-1 for both filaments, which is on the order of the marker size.
Current usage metrics show cumulative count of Article Views (full-text article views including HTML views, PDF and ePub downloads, according to the available data) and Abstracts Views on Vision4Press platform.
Data correspond to usage on the plateform after 2015. The current usage metrics is available 48-96 hours after online publication and is updated daily on week days.
Initial download of the metrics may take a while.