Fig. 1
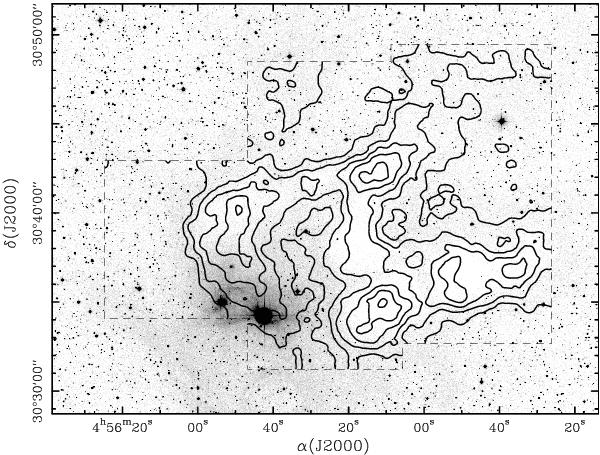
Map of the C18O(1–0) integrated intensity towards the L1517 cloud superposed to the red DSS image. The emission has been integrated over the whole velocity range of detection (VLSR = 5.25−6.45 km s-1). First contour and contour interval are 0.22 K km s-1. The two bright stars surrounded by nebulosity and located near the southeastern edge of the C18O(1–0) emission are AB Aur (brightest) and SU Aur.
Current usage metrics show cumulative count of Article Views (full-text article views including HTML views, PDF and ePub downloads, according to the available data) and Abstracts Views on Vision4Press platform.
Data correspond to usage on the plateform after 2015. The current usage metrics is available 48-96 hours after online publication and is updated daily on week days.
Initial download of the metrics may take a while.