Fig. 4
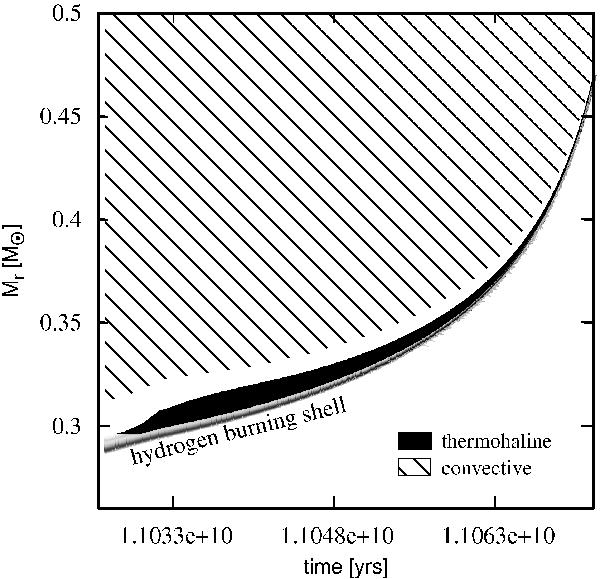
Evolution of the region between the HBS and the convective envelope, when the prescription of Kippenhahn et al. (1980) is adopted to compute the diffusion coefficient in the thermohaline zone. The time interval spans from the instant when the stars luminosity reaches L ≈ 96 (i.e., before the luminosity bump) until L ≈ 1826, close to the top of the RGB. The figure corresponds to the 0.9 M⊙, Z = 1 × 10⁻³, model.
Current usage metrics show cumulative count of Article Views (full-text article views including HTML views, PDF and ePub downloads, according to the available data) and Abstracts Views on Vision4Press platform.
Data correspond to usage on the plateform after 2015. The current usage metrics is available 48-96 hours after online publication and is updated daily on week days.
Initial download of the metrics may take a while.