Fig. 2
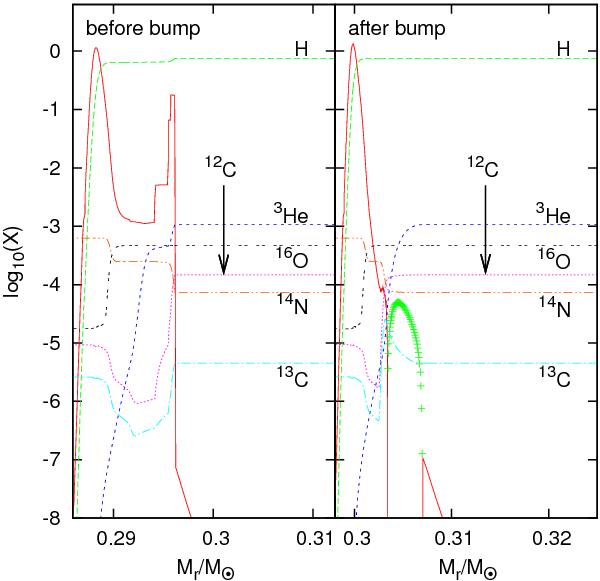
Profiles of the abundances of H, 3He, 12C, 13C, 14N, 16O and of the mean molecular weight gradient ∇μ as a function of mass coordinate. The full line stands for ∇μ > 0 and the plus signs otherwise. Left and right panels correspond to the situation before and after the bump, respectively, for a 0.9 M⊙ model with 1 × 10⁻³. The abscissa ranges from the bottom of the hydrogen-burning shell to the base of the convective envelope.
Current usage metrics show cumulative count of Article Views (full-text article views including HTML views, PDF and ePub downloads, according to the available data) and Abstracts Views on Vision4Press platform.
Data correspond to usage on the plateform after 2015. The current usage metrics is available 48-96 hours after online publication and is updated daily on week days.
Initial download of the metrics may take a while.