Fig. 7
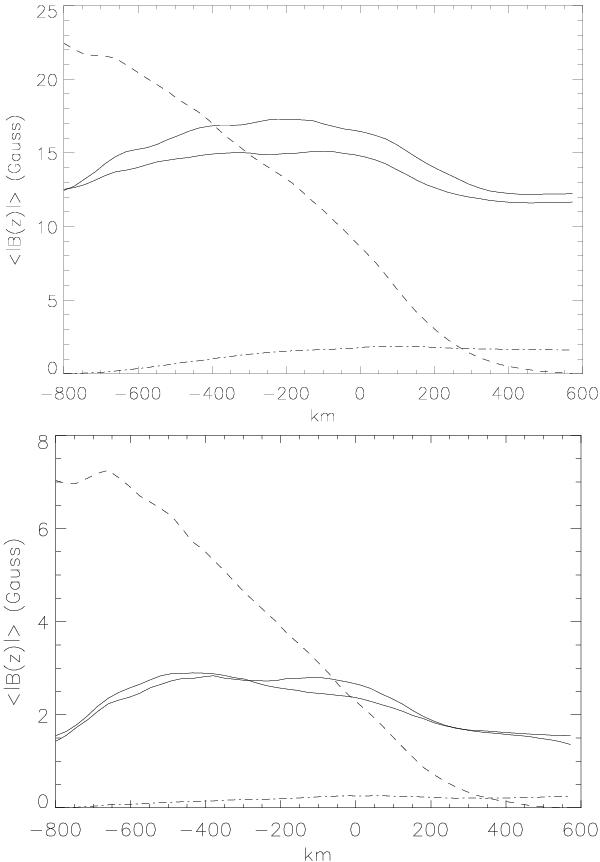
Unsigned flux density as a function of height for the four connectivities. The solid lines correspond to the top-bottom and bottom-top connectivities, the dashed lines to inverse-U loops, and the dot-dashed line to U loops. The upper panel is for t = 16 min, soon after the initial transient phase. Already a substantial amount of inverse-U loop flux has been generated. The lower panel is for t = 142 min. The top-bottom and bottom-top connectivities use the same linestyle to reflect the B → (−B) symmetry of the MHD equations.
Current usage metrics show cumulative count of Article Views (full-text article views including HTML views, PDF and ePub downloads, according to the available data) and Abstracts Views on Vision4Press platform.
Data correspond to usage on the plateform after 2015. The current usage metrics is available 48-96 hours after online publication and is updated daily on week days.
Initial download of the metrics may take a while.