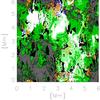
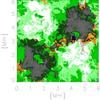
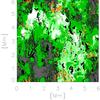
Fig. 6
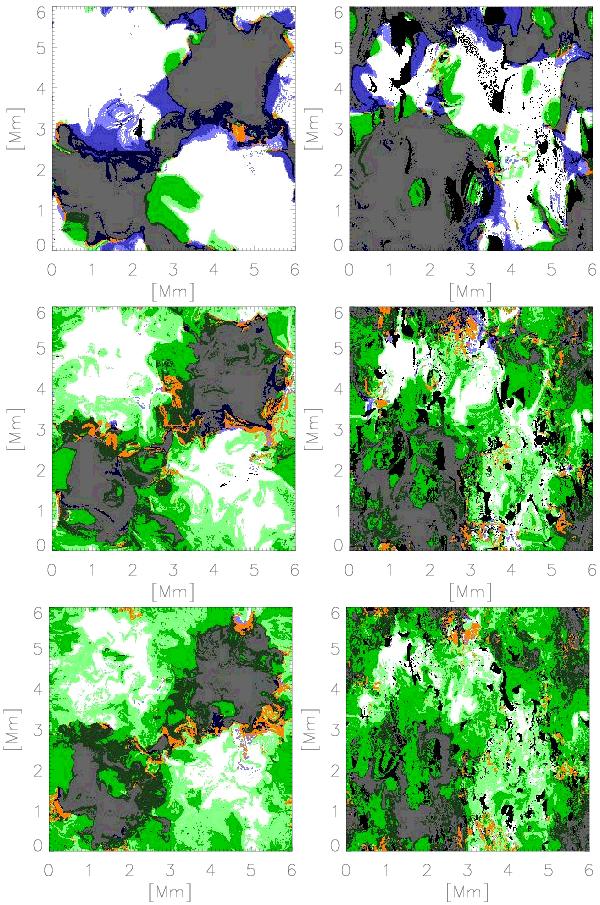
Field line connectivities at 3 heights (from bottom to top: z = −420 km, z = 0 and z = 420 km). As described in the text, field lines were traced from the centre of each of the 288 × 288 × 100 grid cells, so that on average each cell contains many field lines. The left panels correspond to t = 16 min, the right panels to t = 142 min of simulated time. White indicates areas where field lines pass from the bottom of the box to the top. Grey shows areas where field lines run from the top of the box to the bottom. Green indicates cells where all field lines have both legs passing through the bottom of the box (inverse-U loops). Blue indicates U loops with both legs passing through the upper surface. Light (dark) green indicates the presence of both inverse-U loops and field lines running from the bottom of the box to the top (top to bottom), within one grid cell. Light and dark blue regions are similarly defined but for U loops. The orange regions indicate where at least three types of field lines pass through a single grid cell.
Current usage metrics show cumulative count of Article Views (full-text article views including HTML views, PDF and ePub downloads, according to the available data) and Abstracts Views on Vision4Press platform.
Data correspond to usage on the plateform after 2015. The current usage metrics is available 48-96 hours after online publication and is updated daily on week days.
Initial download of the metrics may take a while.