Free Access
Fig. 5
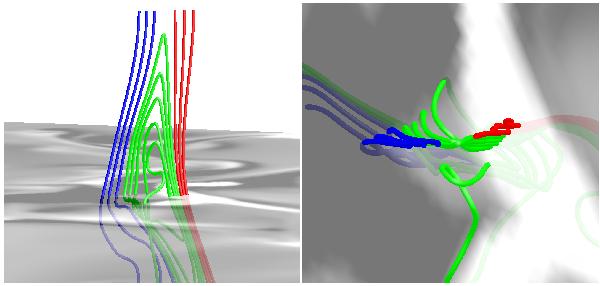
The colored lines are a 3D visualization of field lines at beginning of the reconnection event shown in the 4. The grey-scale corresponds to the vertical component of the field at z = 0. The left panel is a side view, the right panel is a top view.
This figure is made of several images, please see below:
Current usage metrics show cumulative count of Article Views (full-text article views including HTML views, PDF and ePub downloads, according to the available data) and Abstracts Views on Vision4Press platform.
Data correspond to usage on the plateform after 2015. The current usage metrics is available 48-96 hours after online publication and is updated daily on week days.
Initial download of the metrics may take a while.