Fig. 4
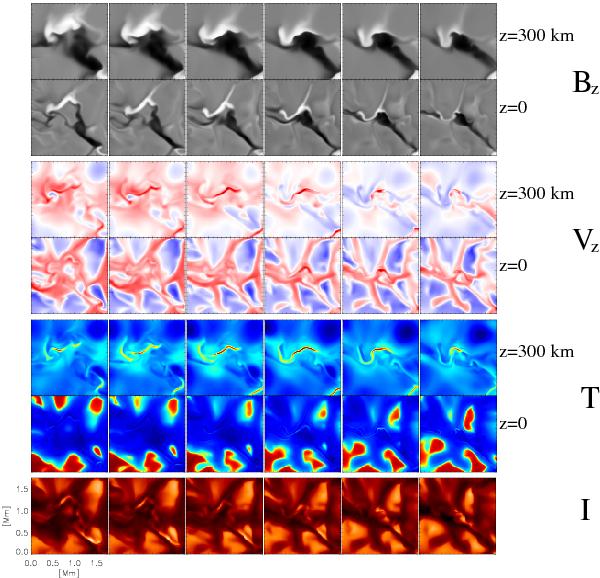
Time series of a reconnection event (2 × 2 run, non-grey), approximately 30 min after introduction of magnetic field. The time between snapshots is 30 s. From top to bottom are the vertical component of the magnetic field, the vertical component of the velocity, the temperature and lastly the bolometric intensity. The first three quantities are shown at two heights, near z = 0 km (lower rows) and near z = 300 km (upper rows). The horizontal extent of the maps is 1.75 × 1.75 Mm2. The intensity timeseries corresponds to the continuum intensity at 500 nm. The greyscale for the magnetic field covers the range from –530 G to +530 G at z = 300 km and from –1760 G to 1760 G at z = 0; the velocity range is from –7 km s-1 to 7 km s-1 at z = 300 km and –9 km s-1 to 9 km s-1 at z = 0; the temperature range is from 4000° (blue) to 7500° (red) at z = 300 km and 5000° to 10 000° at z = 0; and the intensity varies between 0.65 and 1.5 of the averge quiet Sun value.

Current usage metrics show cumulative count of Article Views (full-text article views including HTML views, PDF and ePub downloads, according to the available data) and Abstracts Views on Vision4Press platform.
Data correspond to usage on the plateform after 2015. The current usage metrics is available 48-96 hours after online publication and is updated daily on week days.
Initial download of the metrics may take a while.