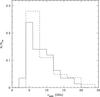
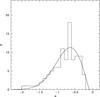
Fig. 9

Left panel: distribution of the observed peak frequencies for the sample of inverted-spectrum sources defined in the text (solid line), and for the GPS/HFP candidates in Torniainen et al. (2008). Right panel: distribution of the spectral indexes above the peak frequency for the inverted-spectrum sources. The solid line is given by  , with α0 = −0.10 and σα = 0.53.
Current usage metrics show cumulative count of Article Views (full-text article views including HTML views, PDF and ePub downloads, according to the available data) and Abstracts Views on Vision4Press platform.
Data correspond to usage on the plateform after 2015. The current usage metrics is available 48-96 hours after online publication and is updated daily on week days.
Initial download of the metrics may take a while.