Fig. 7
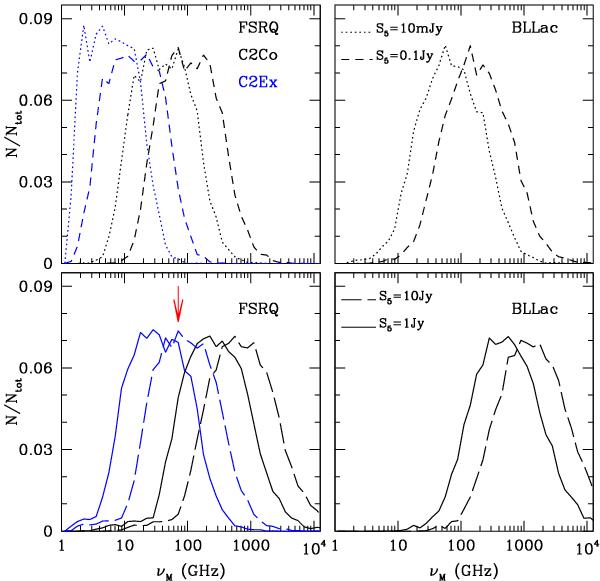
Distribution of the break frequency, νM, for 104 sources with 5-GHz flux density of 10/1/0.1/0.01 Jy (see labels in figure); the rM values correspond to the cases C2Co (black lines) and C2Ex (blue lines). In the two upper panels only model predictions corresponding to the flux densities of 0.01 and 0.1 Jy are shown; in the two lower panels, only predictions corresponding to 1 and 10 Jy are shown. In the lower panel on the left side we also plot the νM (red vertical arrow) of 3C 273 estimated by Clegg et al. (1983).
Current usage metrics show cumulative count of Article Views (full-text article views including HTML views, PDF and ePub downloads, according to the available data) and Abstracts Views on Vision4Press platform.
Data correspond to usage on the plateform after 2015. The current usage metrics is available 48-96 hours after online publication and is updated daily on week days.
Initial download of the metrics may take a while.