Free Access
Fig. 4
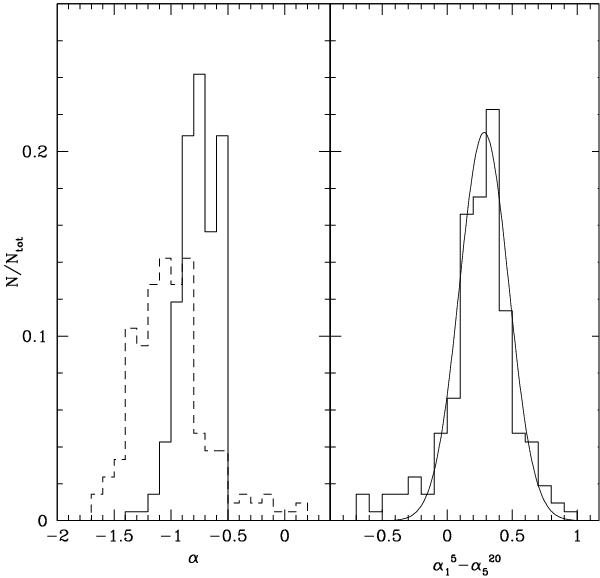
Left panel: distributions of 1–5 GHz (solid line) and 5–20 GHz (dashed line) spectral indices of steep-spectrum sources selected from the AT20G catalogue. Right panel: distribution of the difference  . The thin line is the Gaussian fit.
Current usage metrics show cumulative count of Article Views (full-text article views including HTML views, PDF and ePub downloads, according to the available data) and Abstracts Views on Vision4Press platform.
Data correspond to usage on the plateform after 2015. The current usage metrics is available 48-96 hours after online publication and is updated daily on week days.
Initial download of the metrics may take a while.