Fig. 2
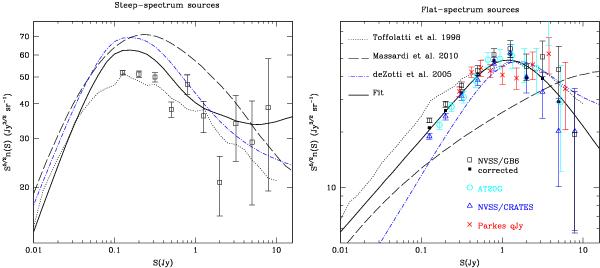
Differential number counts at 4.8 GHz of steep-spectrum (left panel) and flat-spectrum (right panel) ERS from the NVSS/GB6 data (black empty squares). The predictions from the cosmological evolution models plotted in Fig. 1 are represented here by the same line-types as in that figure. In the left panel the thick continuous line represents the difference between the total number counts of the Toffolatti et al. (1998) evolution model and our best fit to the observed number counts of flat-spectrum ERS (right panel; thick continuous line), i.e., it represents our best estimate of the differential number counts of steep-spectrum ERS. In the right panel we also plot the number counts of flat-spectrum ERS estimated from i) NVSS/GB6 data but corrected for resolution effects (black solid squares); ii) the Jackson et al. (2002) sample (red astericks); iii) the CRATES sub-sample in the GB6 sky area (blue empty triangles); iv) the 5-GHz sample of AT20G sources (cyan empty circles). See Sect. 2 for more details.
Current usage metrics show cumulative count of Article Views (full-text article views including HTML views, PDF and ePub downloads, according to the available data) and Abstracts Views on Vision4Press platform.
Data correspond to usage on the plateform after 2015. The current usage metrics is available 48-96 hours after online publication and is updated daily on week days.
Initial download of the metrics may take a while.