Fig. 14
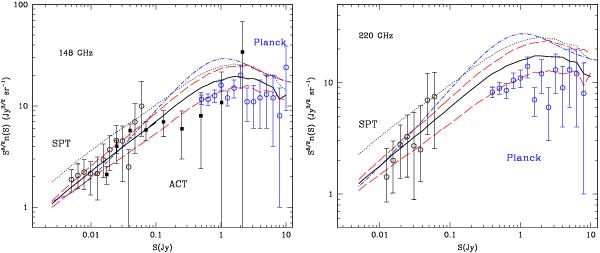
Comparison between predicted and observed differential number counts at 148 GHz (left panel) and at 220 GHz (right panel). Filled circles: ACT data; open black circles: SPT data; open blue circles: Planck ERCSC counts (Planck Collaboration 2011c) at 143 GHz (left panel) and 217 GHz (right panel). The lines have the same meaning as in Fig. 11.
Current usage metrics show cumulative count of Article Views (full-text article views including HTML views, PDF and ePub downloads, according to the available data) and Abstracts Views on Vision4Press platform.
Data correspond to usage on the plateform after 2015. The current usage metrics is available 48-96 hours after online publication and is updated daily on week days.
Initial download of the metrics may take a while.