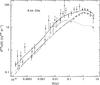
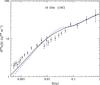
Fig. 10

Predicted differential number counts normalized to S-2.5 at 8.44 GHz (left panel) and at 15 GHz (right panel) for the C1 model (thick continuous line), i.e. the model with no difference between the rM value adopted for FSRQs and BL Lac objects (see text). At 8.44 GHz data points are a collection from different samples (see De Zotti et al. 2010), whereas at 15 GHz they have been computed from the 10C survey. In the left panel predictions for number counts of flat- (short-dashed line) and steep-spectrum (dotted line) sources are also shown, compared with results from measurements at 8.4 GHz of flat-spectrum sources by the CRATES program (empty circular points). Predictions at 15 GHz from the De Zotti et al. (2005) model are also shown (blue dash-dotted line).
Current usage metrics show cumulative count of Article Views (full-text article views including HTML views, PDF and ePub downloads, according to the available data) and Abstracts Views on Vision4Press platform.
Data correspond to usage on the plateform after 2015. The current usage metrics is available 48-96 hours after online publication and is updated daily on week days.
Initial download of the metrics may take a while.