Fig. 5
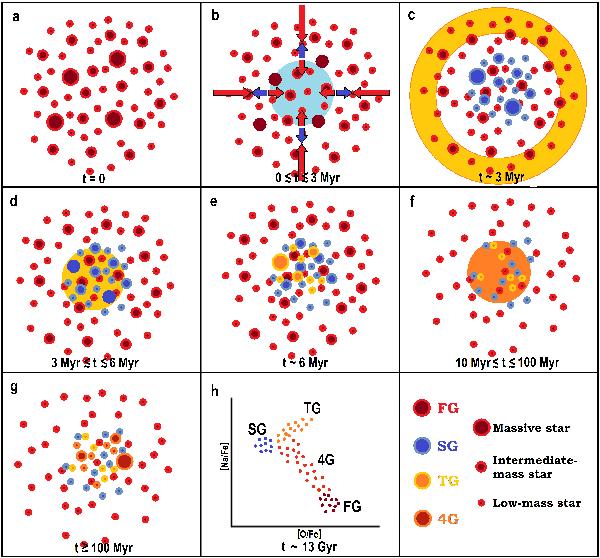
As in Fig. 1, but for massive PSs. Stars of the first, second, third, and fourth generations are represented as red, blue, yellow, and orange circles, respectively. Panels represent: a) formation of FG stars; b) gas accumulation, from a mix of winds of FG massive stars plus pristine gas; c) first core-collapse SN explosions, which trigger the formation of SG stars; d) gas accumulation, from a mix of FG SN ejecta, winds of FG and SG massive stars, and gas remaining from the formation of SG stars; e) formation of TG stars, when SN explosions end; f) gas accumulation, from winds of super-AGB and AGB stars from all generations; g) formation of 4G stars; h) present-day O-Na anticorrelation. This figure is available in color in electronic form.
Current usage metrics show cumulative count of Article Views (full-text article views including HTML views, PDF and ePub downloads, according to the available data) and Abstracts Views on Vision4Press platform.
Data correspond to usage on the plateform after 2015. The current usage metrics is available 48-96 hours after online publication and is updated daily on week days.
Initial download of the metrics may take a while.