Free Access
Fig. 2
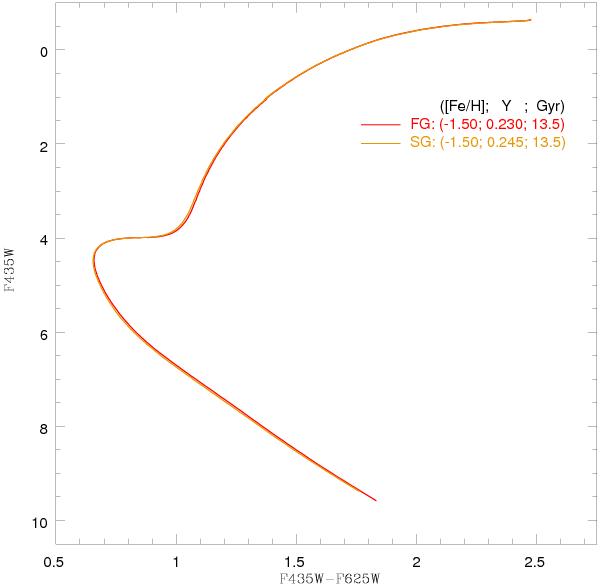
CMD of a low-mass PS after 13 Gyr. PGPUC isochrones represent the two surviving populations for this system: FG (red lines) and SG (orange lines). This figure is available in color in electronic form.
Current usage metrics show cumulative count of Article Views (full-text article views including HTML views, PDF and ePub downloads, according to the available data) and Abstracts Views on Vision4Press platform.
Data correspond to usage on the plateform after 2015. The current usage metrics is available 48-96 hours after online publication and is updated daily on week days.
Initial download of the metrics may take a while.