Free Access
Fig. 8
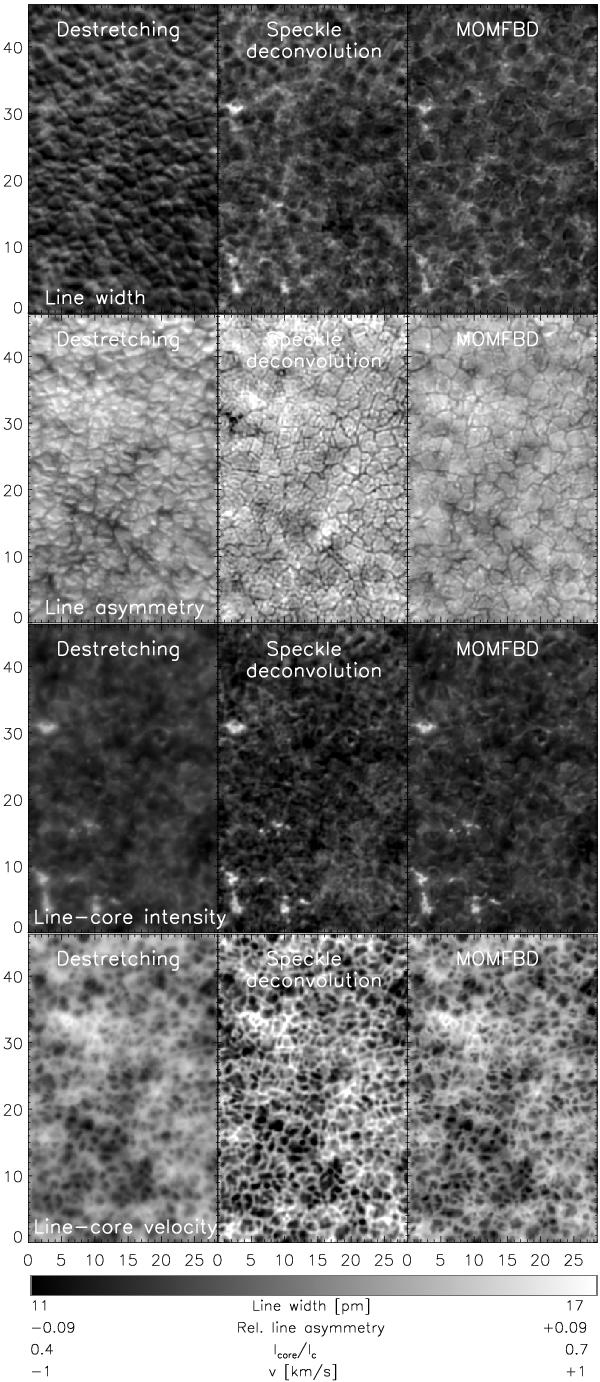
Line parameters. Top to bottom: line width, line asymmetry, line-core intensity, and line-core velocity. Left to right: destretched data, speckle-deconvolved data, MOMFBD data. Tick marks are in arcsec. The display ranges are given by the gray-scale bar at bottom.
Current usage metrics show cumulative count of Article Views (full-text article views including HTML views, PDF and ePub downloads, according to the available data) and Abstracts Views on Vision4Press platform.
Data correspond to usage on the plateform after 2015. The current usage metrics is available 48-96 hours after online publication and is updated daily on week days.
Initial download of the metrics may take a while.