Fig. 7
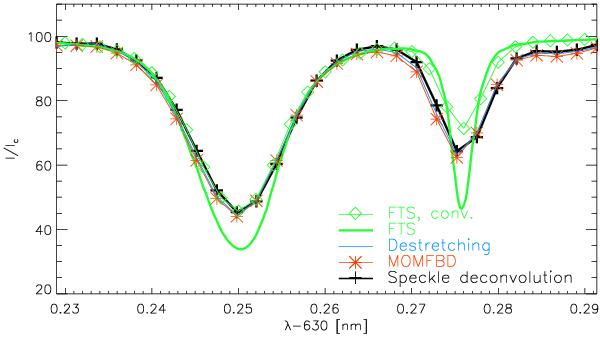
Average profiles of the Göttingen FPI. Black line with crosses: speckle deconvolution. Red line with asterisks: MOMFBD. Blue line: destretched data. The thick green line (thin green line with diamonds) shows the corresponding FTS atlas profile before (after) the convolution with the instrumental profile.
Current usage metrics show cumulative count of Article Views (full-text article views including HTML views, PDF and ePub downloads, according to the available data) and Abstracts Views on Vision4Press platform.
Data correspond to usage on the plateform after 2015. The current usage metrics is available 48-96 hours after online publication and is updated daily on week days.
Initial download of the metrics may take a while.