Fig. 4
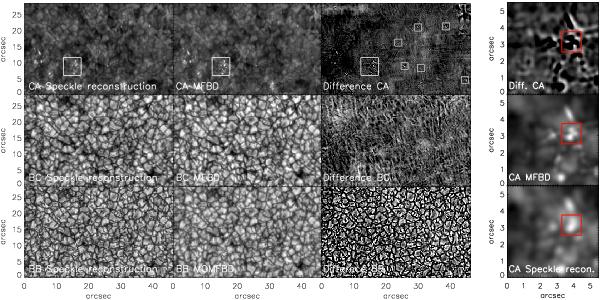
Overview maps of the imaging data. Bottom to top: Göttingen FPI BB channel, blue continuum, and Ca. Left to right: speckle reconstruction, (MO)MFBD, and difference image. The display ranges for the intensity maps are 0.8 < I < 1.5 for Ca and 0.8 < I < 1.2 otherwise. The difference images are thresholded at ±0.05. The large white rectangles denote the region shown magnified in the rightmost column, the small grey squares indicate locations with ring structures in the Ca difference image.
Current usage metrics show cumulative count of Article Views (full-text article views including HTML views, PDF and ePub downloads, according to the available data) and Abstracts Views on Vision4Press platform.
Data correspond to usage on the plateform after 2015. The current usage metrics is available 48-96 hours after online publication and is updated daily on week days.
Initial download of the metrics may take a while.