Fig. 3
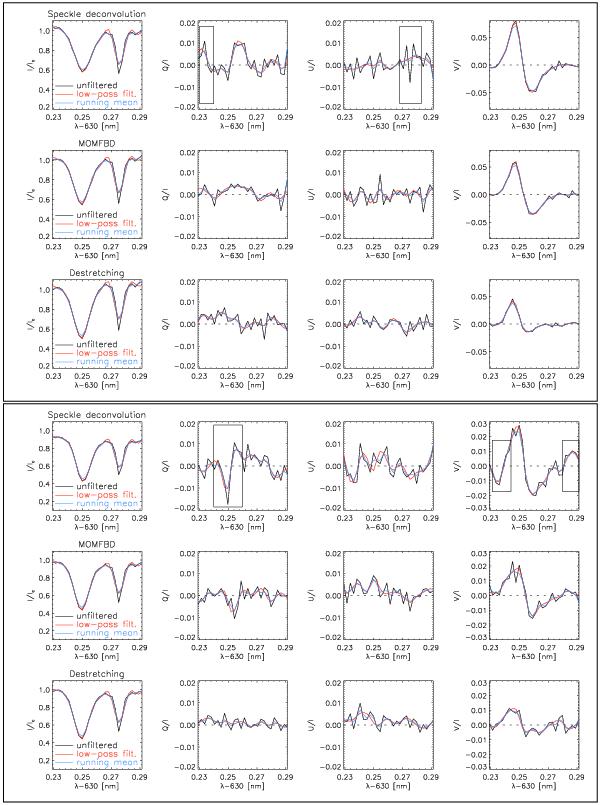
Example spectra in the network (top panel) and in a small isolated polarization patch (bottom panel). Left to right: Stokes IQUV. Top to bottom: speckle deconvolution, MOMFBD, and destretched data. Black/red/blue lines: unfiltered data/low-pass filter/running mean. The black rectangles denote noise peaks that could be mistaken for solar polarization signal after the filtering.
Current usage metrics show cumulative count of Article Views (full-text article views including HTML views, PDF and ePub downloads, according to the available data) and Abstracts Views on Vision4Press platform.
Data correspond to usage on the plateform after 2015. The current usage metrics is available 48-96 hours after online publication and is updated daily on week days.
Initial download of the metrics may take a while.