Fig. 2
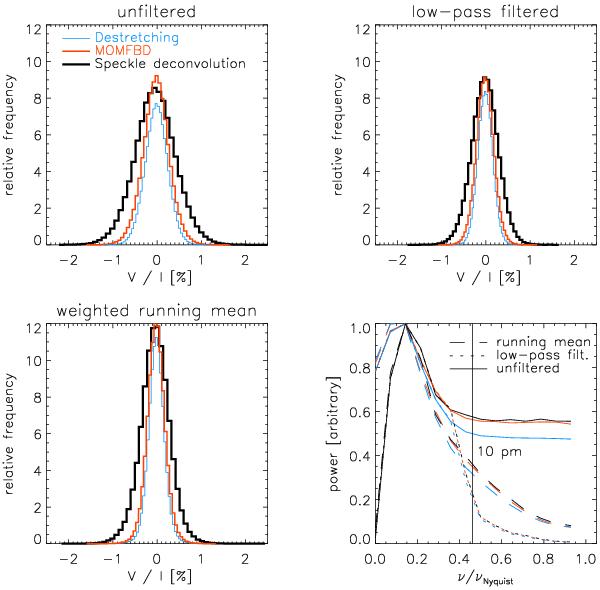
Histograms of the polarization amplitude of Stokes V/I in a continuum window. Top left: unfiltered data for speckle deconvolution (black), MOMFBD (red), and destretching (blue). Top right and bottom left: the same for application of a low-pass filter and of a weighted running mean, respectively. Bottom right: Fourier power vs. spectral frequency. Solid/dotted/dashed lines: unfiltered/low-pass filtered/running mean. The vertical black line corresponds to a wavelength of 10 pm.
Current usage metrics show cumulative count of Article Views (full-text article views including HTML views, PDF and ePub downloads, according to the available data) and Abstracts Views on Vision4Press platform.
Data correspond to usage on the plateform after 2015. The current usage metrics is available 48-96 hours after online publication and is updated daily on week days.
Initial download of the metrics may take a while.