Fig. 14
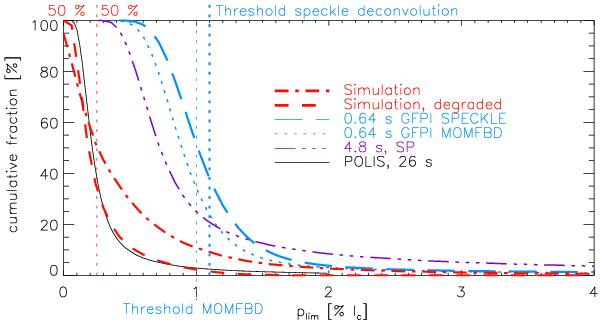
Cumulative fraction of profiles with a polarization degree above plim. Thin black: POLIS data with 26 secs integration time. Purple thin dash-dotted: Hinode/SP. Blue dotted: MOMFBD Göttingen FPI data. Blue long dashed: speckle-deconvolved Göttingen FPI data. Thick red dash-dotted: MHD simulation. Thick red dashed: spatially degraded MHD simulation. The vertical red dotted line denotes the 50% fraction of the MHD simulation. The vertical blue dotted lines mark the significance threshold for the MOMFBD and speckle-deconvolved spectra.
Current usage metrics show cumulative count of Article Views (full-text article views including HTML views, PDF and ePub downloads, according to the available data) and Abstracts Views on Vision4Press platform.
Data correspond to usage on the plateform after 2015. The current usage metrics is available 48-96 hours after online publication and is updated daily on week days.
Initial download of the metrics may take a while.