Fig. 12
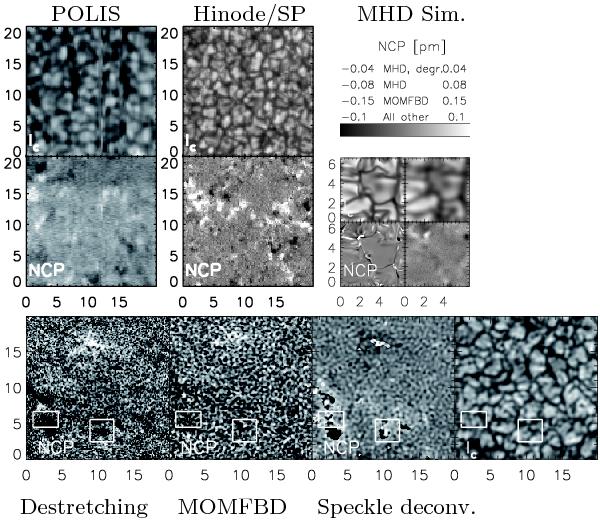
NCP and intensity maps of the data sets. Bottom row, left to right: maps of the NCP for the destretched, MOMFBD, and speckle-deconvolved Göttingen FPI spectra, and continuum intensity. Top left: continuum intensity (top panel) and NCP for the POLIS data set. Top middle: same for the Hinode/SP data set. Top right: continuum intensity and NCP for the MHD simulation in full (left) and degraded resolution (right). All tick marks are in arcsec.
Current usage metrics show cumulative count of Article Views (full-text article views including HTML views, PDF and ePub downloads, according to the available data) and Abstracts Views on Vision4Press platform.
Data correspond to usage on the plateform after 2015. The current usage metrics is available 48-96 hours after online publication and is updated daily on week days.
Initial download of the metrics may take a while.