Fig. 11
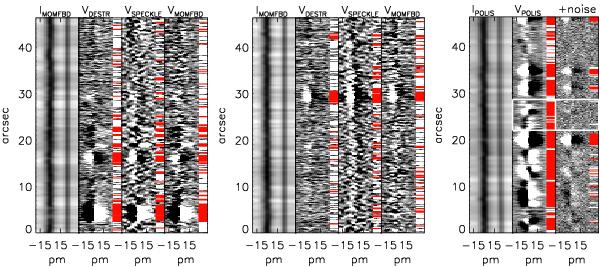
Stokes I and V spectra along the two cuts marked in Fig. 9 (left two panels), and in a reference data set taken with POLIS (right panel). Left panel, left to right: intensity spectrum, Stokes V of the destretched, speckle-deconvolved, and MOMFBD data, respectively. The display range of V is ± 0.5%. Middle panel: the same for the second cut. Right panel, left to right: I and V (±0.1%) from the POLIS data, V plus 0.2% rms noise with a display threshold of ±0.5%. The white markers at the right border of Stokes V denote Vmax > 2.5σ, the red markers Vmax above the finally chosen significance level.
Current usage metrics show cumulative count of Article Views (full-text article views including HTML views, PDF and ePub downloads, according to the available data) and Abstracts Views on Vision4Press platform.
Data correspond to usage on the plateform after 2015. The current usage metrics is available 48-96 hours after online publication and is updated daily on week days.
Initial download of the metrics may take a while.