Fig. 4
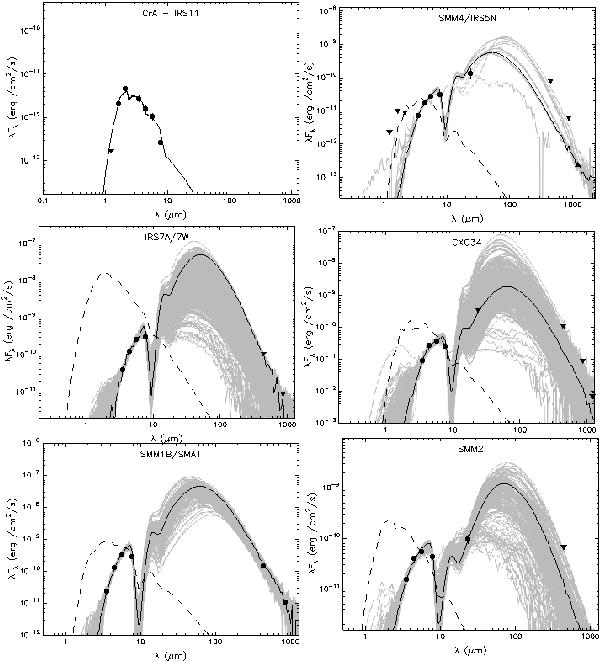
The observed SEDs and their best-fit models. Top left panel shows an example of an extincted photosphere while the rest are YSOs. Circular symbols represent the data points, upward-facing triangles are lower limits and downward facing triangles are upper limits. The dashed line corresponds to the stellar photosphere model used in the best YSO model fit. The gray lines show the models that satisfy the χ2 criteria described in the text. For the source IRS5N, the SMA data by Peterson et al. (2011) is additionally used in the SED fitting.
Current usage metrics show cumulative count of Article Views (full-text article views including HTML views, PDF and ePub downloads, according to the available data) and Abstracts Views on Vision4Press platform.
Data correspond to usage on the plateform after 2015. The current usage metrics is available 48-96 hours after online publication and is updated daily on week days.
Initial download of the metrics may take a while.