Free Access
Fig. 2
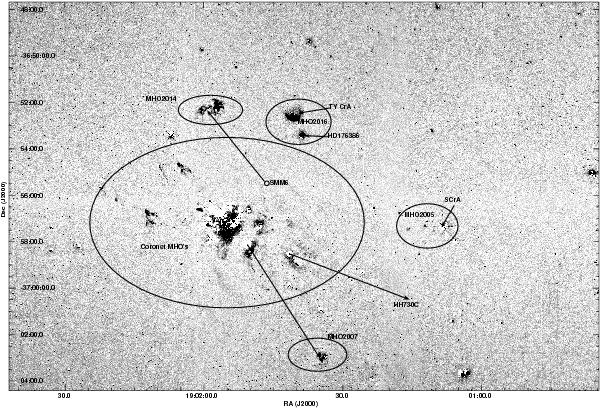
Continuum-subtracted H2 image of the mapped region, displayed with linear gray scales. Five groups of H2 line emission features are marked by ellipses.
Current usage metrics show cumulative count of Article Views (full-text article views including HTML views, PDF and ePub downloads, according to the available data) and Abstracts Views on Vision4Press platform.
Data correspond to usage on the plateform after 2015. The current usage metrics is available 48-96 hours after online publication and is updated daily on week days.
Initial download of the metrics may take a while.