Fig. 6
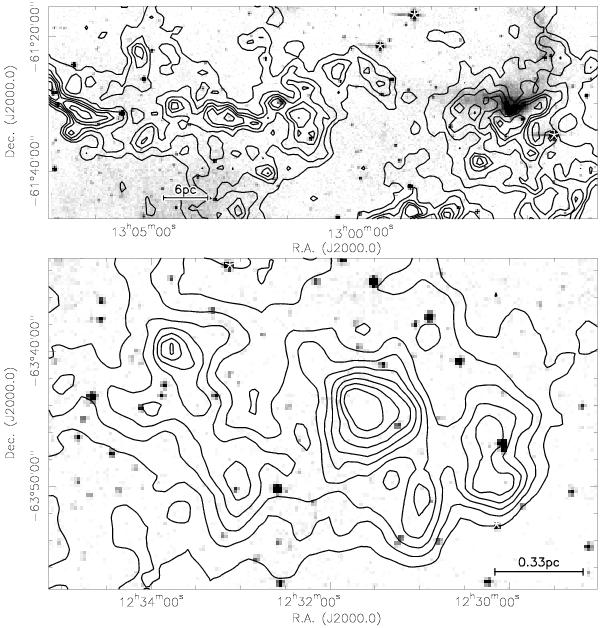
The grayscaling presents the 8 μm data toward the R1 (top) and R2 (bottom) regions as observed with MSX. The contours outline the extinction from Kainulainen et al. (2009) for R1 in 1 mag steps between Av of 5 and 9 mag plus additional contours at 11 and 13 mag, and for R2 in 1 mag steps starting at an Av of 2 mag. The white stars mark the only sources that were also detected with MSX at 21 μm.
Current usage metrics show cumulative count of Article Views (full-text article views including HTML views, PDF and ePub downloads, according to the available data) and Abstracts Views on Vision4Press platform.
Data correspond to usage on the plateform after 2015. The current usage metrics is available 48-96 hours after online publication and is updated daily on week days.
Initial download of the metrics may take a while.