Fig. 4
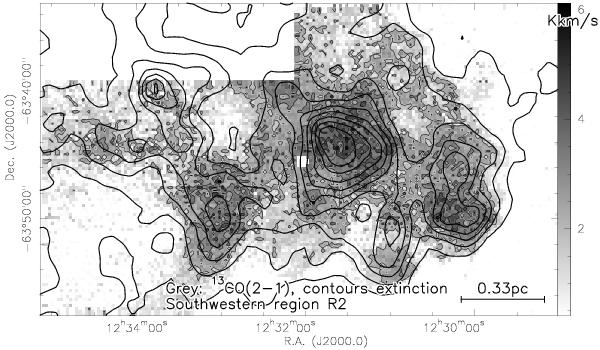
The grayscale with thin contours shows the integrated 13CO(2–1) emission toward the southwestern region R2. Contour levels start at 2 K km s-1 and continue in 1 K km s-1 steps. The thick contours outline the extinction from Kainulainen et al. (2009) in 1 mag steps starting at an Av of 2 mag. A linear scale-bar is shown in the bottom-right corner.
Current usage metrics show cumulative count of Article Views (full-text article views including HTML views, PDF and ePub downloads, according to the available data) and Abstracts Views on Vision4Press platform.
Data correspond to usage on the plateform after 2015. The current usage metrics is available 48-96 hours after online publication and is updated daily on week days.
Initial download of the metrics may take a while.