Fig. 3
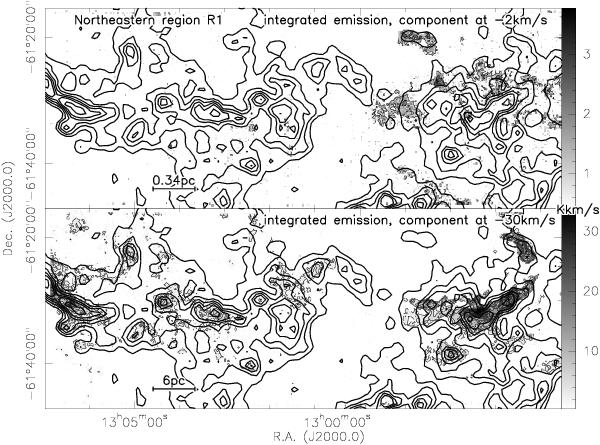
Compilation of the integrated emission in grayscale (with thin contours) from the –2 km s-1 and –30 km s-1 components in 13CO(2–1) toward the northeastern region R1 in the top and bottom panels, respectively. The thick contours outline the extinction from Kainulainen et al. (2009) in 1 mag steps between Av of 5 and 9 mag plus additional contours of 11 and 13 mag. The integration regimes for the top and bottom panels are [–4, 2] and [–35, –24] km s-1, respectively. The thin contours for the –4 km s-1 map start at 1 K km s-1 and continue in 1 K km s-1 steps, whereas for the –30 km s-1 component the contours start at 2 K km s-1 and continue in 2 K km s-1 steps. A linear scale-bar is shown in both panels.
Current usage metrics show cumulative count of Article Views (full-text article views including HTML views, PDF and ePub downloads, according to the available data) and Abstracts Views on Vision4Press platform.
Data correspond to usage on the plateform after 2015. The current usage metrics is available 48-96 hours after online publication and is updated daily on week days.
Initial download of the metrics may take a while.