Free Access
Fig. 10
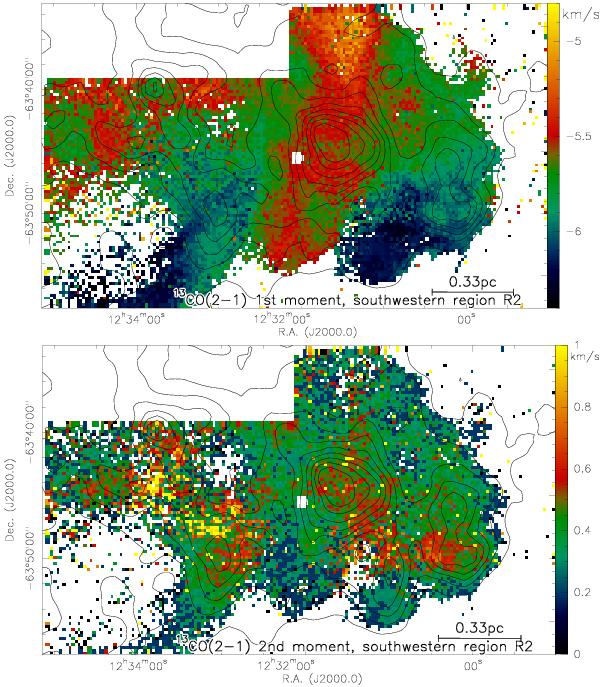
Compilation of 13CO(2–1) 1st and 2nd moment maps toward the southwestern region R2 in the top and bottom panel, respectively. The thick contours outline the extinction from Kainulainen et al. (2009) in 1 mag steps starting at an Av of 2 mag. Linear scale-bars are shown in the bottom-right corner of each panel.
This figure is made of several images, please see below:
Current usage metrics show cumulative count of Article Views (full-text article views including HTML views, PDF and ePub downloads, according to the available data) and Abstracts Views on Vision4Press platform.
Data correspond to usage on the plateform after 2015. The current usage metrics is available 48-96 hours after online publication and is updated daily on week days.
Initial download of the metrics may take a while.