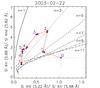
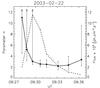
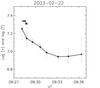
Fig. 4
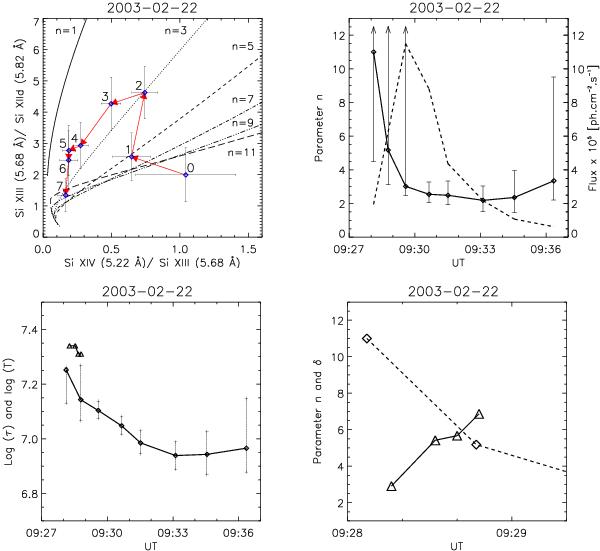
RESIK and RHESSI analysis results of the 2003 February 22 flare. Top left: the synthetic line ratios for n = 1, 3, 5, 7, 9, 11 (solid, dotted, dashed, dot-dashed, dot-dot-dot dashed, and long-dashed lines, respectively), and the measured line ratios (stars) with their error bars. The arrows follow the time evolution of the RESIK spectra (0 marks the first observed spectrum, see Table A.1). Top right: the time evolution of the parameter n (with error bars, upward arrows indicate n > 12) of the n-distribution and the total flux (dashed line) from all four RESIK channels. Bottom left: the time evolution of log τ (diamonds) from RESIK and log T (triangles) from the RHESSI thermal component. Bottom right: the time evolution of the spectral index δ (triangles) in comparison with the parameter n (diamonds and dashed line). This panel zooms in on the time evolution of n depicted in the panel above. The points in all the plots are depicted for the middle time of each spectrum.
Current usage metrics show cumulative count of Article Views (full-text article views including HTML views, PDF and ePub downloads, according to the available data) and Abstracts Views on Vision4Press platform.
Data correspond to usage on the plateform after 2015. The current usage metrics is available 48-96 hours after online publication and is updated daily on week days.
Initial download of the metrics may take a while.