Fig. 2
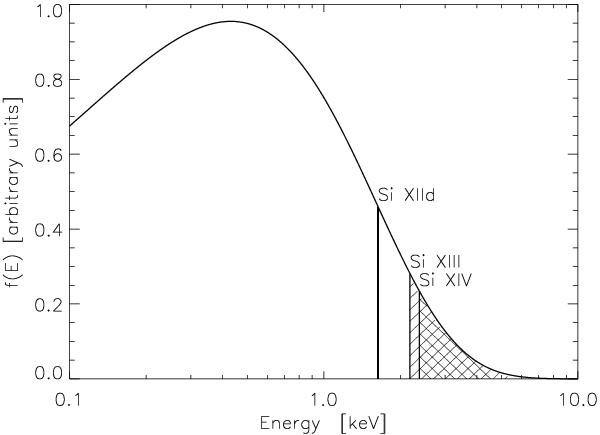
Schematic figure demonstrates which parts of a distribution function influence the intensities of spectral lines (Table 1) used for diagnostics of the n-distribution. The hatched regions of the distribution influence the intensities of the allowed lines of ions Si xiv and Si xiii. The discrete energy of the doubly excited state of Si xiid is marked by a thick vertical line.
Current usage metrics show cumulative count of Article Views (full-text article views including HTML views, PDF and ePub downloads, according to the available data) and Abstracts Views on Vision4Press platform.
Data correspond to usage on the plateform after 2015. The current usage metrics is available 48-96 hours after online publication and is updated daily on week days.
Initial download of the metrics may take a while.