Fig. A.1
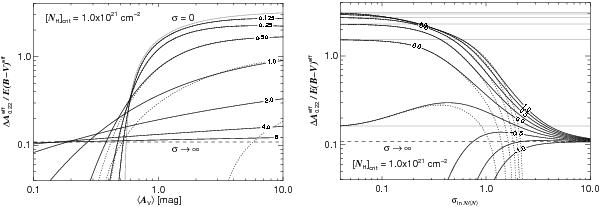
Peak strength of the effective extinction curve caused by a distant turbulent screen as function of the mean extinction (⟨ AV ⟩ ) for given column density contrast (σlnN/ ⟨ N ⟩ ) (left hand figure) and as function of column density contrast for given mean extinction (right hand figure). The curves in the right hand figure are labelled with log AV [mag] . The critical column density is assumed to be [NH] crit = 1021 cm-2. The values in the limit of a non turbulent medium (σ = 0) are shown as grey lines, the value in the the theoretical limit of infinite column density contrast (σ → ∞) as dashed line. Also shown as dotted lines are peak strengths derived using the approximation Eq. (A.3).
Current usage metrics show cumulative count of Article Views (full-text article views including HTML views, PDF and ePub downloads, according to the available data) and Abstracts Views on Vision4Press platform.
Data correspond to usage on the plateform after 2015. The current usage metrics is available 48-96 hours after online publication and is updated daily on week days.
Initial download of the metrics may take a while.