Fig. 3
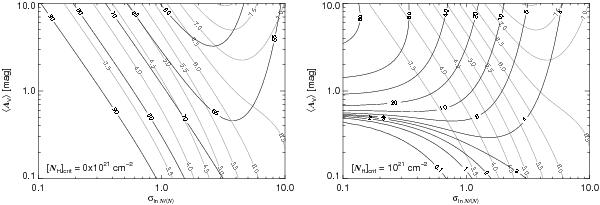
Peak strength  of the
effective extinction curve without (left) and with additional
destruction (right) of the carriers as function of the two
parameters ⟨ AV ⟩
and σlnN/ ⟨ N ⟩
of the turbulent screen. The black curves are lines of constant peak strengths. They
are labelled with the percentage of the peak strength relative to the intrinsic
value. In the right figure the carriers are assumed to be destroyed
below a critical column density of
[NH] crit = 1021 cm-2.
The corresponding RV-values are shown
as grey solid lines.
of the
effective extinction curve without (left) and with additional
destruction (right) of the carriers as function of the two
parameters ⟨ AV ⟩
and σlnN/ ⟨ N ⟩
of the turbulent screen. The black curves are lines of constant peak strengths. They
are labelled with the percentage of the peak strength relative to the intrinsic
value. In the right figure the carriers are assumed to be destroyed
below a critical column density of
[NH] crit = 1021 cm-2.
The corresponding RV-values are shown
as grey solid lines.
Current usage metrics show cumulative count of Article Views (full-text article views including HTML views, PDF and ePub downloads, according to the available data) and Abstracts Views on Vision4Press platform.
Data correspond to usage on the plateform after 2015. The current usage metrics is available 48-96 hours after online publication and is updated daily on week days.
Initial download of the metrics may take a while.