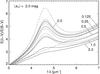
Fig. 2
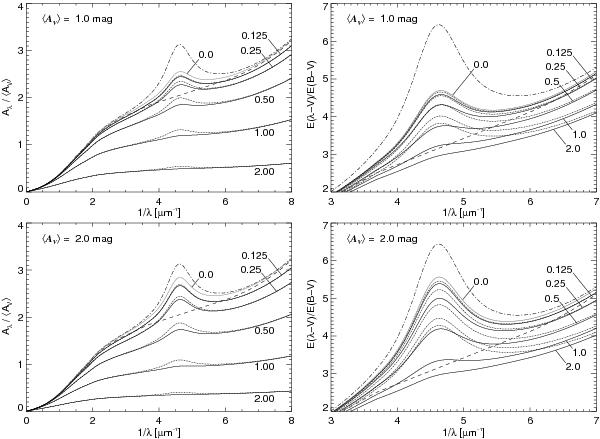
Effective Extinction curves (left hand figure) and reddening curves around the extinction bump (right hand figure) for a turbulent distant screen. The intrinsic extinction curves with and without extinction bump are shown as dashed-dotted and as dashed curve, respectively. The effective extinction and reddening curves without and with change of the dust properties as function of optical depth are shown either as dotted curve or solid curves. Added is also the mean extinction curve for the limit of a non turbulent screen (grey curve). It is assumed that the extinction bump at 2175 Å is absent below a column density NH = 1021 cm-2 which corresponds, assuming RV = 3.1 (Fitzpatrick 1999) and a dust-to-gas-ratio of NH/E(B − V) = 5.8 × 1021 cm-2 (Bohlin et al. 1978), to AV ≈ 0.53 mag. The curves are labelled with the corresponding standard deviation σlnξ of the log-normal density distribution of the normalized column density ξ = NH/ ⟨ NH ⟩ .
Current usage metrics show cumulative count of Article Views (full-text article views including HTML views, PDF and ePub downloads, according to the available data) and Abstracts Views on Vision4Press platform.
Data correspond to usage on the plateform after 2015. The current usage metrics is available 48-96 hours after online publication and is updated daily on week days.
Initial download of the metrics may take a while.